Day 8: Segregation in Michigan
Institutional Racism is defined as “the systematic distribution of resources, power and opportunity in our society to the benefit of people who are white and the exclusion of people of color.” — Solid Ground, Definition & Analysis of Institutional Racism
When you hear the word segregation, what do you think of? Many of us think back to the Civil Rights Movement. Yet, American cities continue to be highly segregated. Using U.S. Census Bureau data, Governing Magazine found Detroit ranks as the fourth-most segregated metro area in the nation, and Michigan cities such as Grand Rapids and Battle Creek have a high rate of segregation in housing.
Present-day racism was built on a long history of racially distributed resources and ideas that shape our view of others and ourselves. A hierarchical system comes with a broad range of policies and institutions that keep it in place. Policies shaped by institutional racism that enforce segregation include redlining, predatory lending, excluding Black veterans from the G.I. Bill, and the forced segregation of neighborhoods by the Federal Housing Authority. As a result of institutional racism, inequities persist in employment, housing, education, healthcare, government and other sectors.
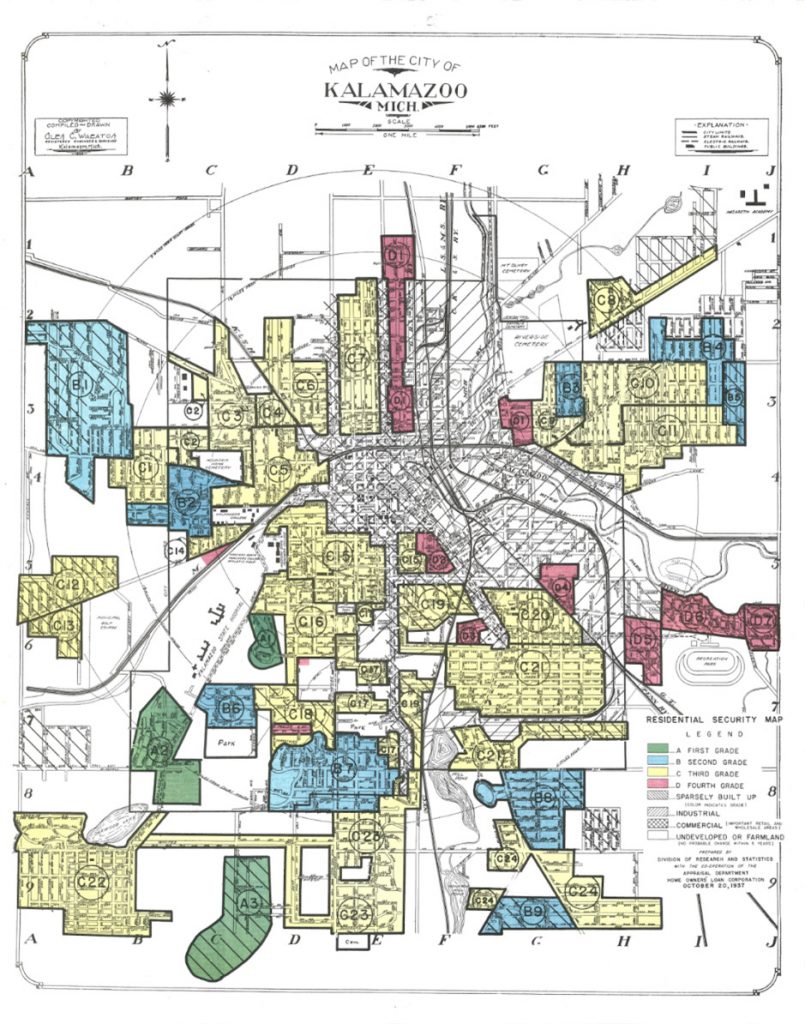
“Residential Security” maps like the one shown below were created by the Home Owners’ Loan Corporation (HOLC) beginning in the 1930’s for cities across the US. These maps reveal how loan officers, appraisers and real estate professionals evaluated “mortgage risk”, which was then used to carry out racist lending practices for much of the 20th century. Data on racial and ethnic identity along with class of residents was included in the data collected. Neighborhoods were then color-coded on maps: green for the “Best” – white, mostly middle class neighborhoods, deemed most deserving of home ownership; blue for “Still Desirable”; yellow for “Definitely Declining” – usually used to identify white immigrant neighborhoods; and red for “Hazardous” – used for African American communities (source). Recent studies reveal a persistent pattern of both economic and racial residential exclusion, and provide further evidence that the segregated structures of the past still exist in many U.S. cities to this day.

https://www.bridgemi.com/michigan-government/kalamazoo-then-and-now
Today’s Challenge:

Explore: Explore the Racial Dot Map created by the University of Virginia, which uses colored dots to visualize how racial segregation appears in our communities. We encourage you to zoom into Michigan and your county to see how it plays out in our backyard. Read more about the methodology here.

Watch: Watch the presentation How FDR Segregated Kalamazoo by Kalamazoo Public Library’s Matt Smith about the history of redlining, racially restrictive covenants, and segregation in Kalamazoo – and how this history lives on in our region’s housing policies today.(1:33:37)

Watch: Why are cities still so segregated? Watch this quick video where NPR’s Code Switch looks at the factors contributing to modern day segregation. (Note: Includes explicit language in first 15 seconds) (6:36)
Discussion
In what ways have historical racist policies affected citie’s/neighborhoods’ ability to thrive?
What observations most stood out to you when examining the historical and present-day maps?
Why?
How are we willing to address the space between us in our own lives?
If we agree that segregation exacerbates stereotypes, creates social distance, and even diminishes the income and life expectancy of others, how can we rectify it?


